I hope you enjoyed this little journey. You experienced it in 5 minutes, but for me there were years of hard work.
Maxim Grivennyy
OS Compatibility
Lode
I built it as a web app, so the dashboard is easily accessible from any device, with no install required.
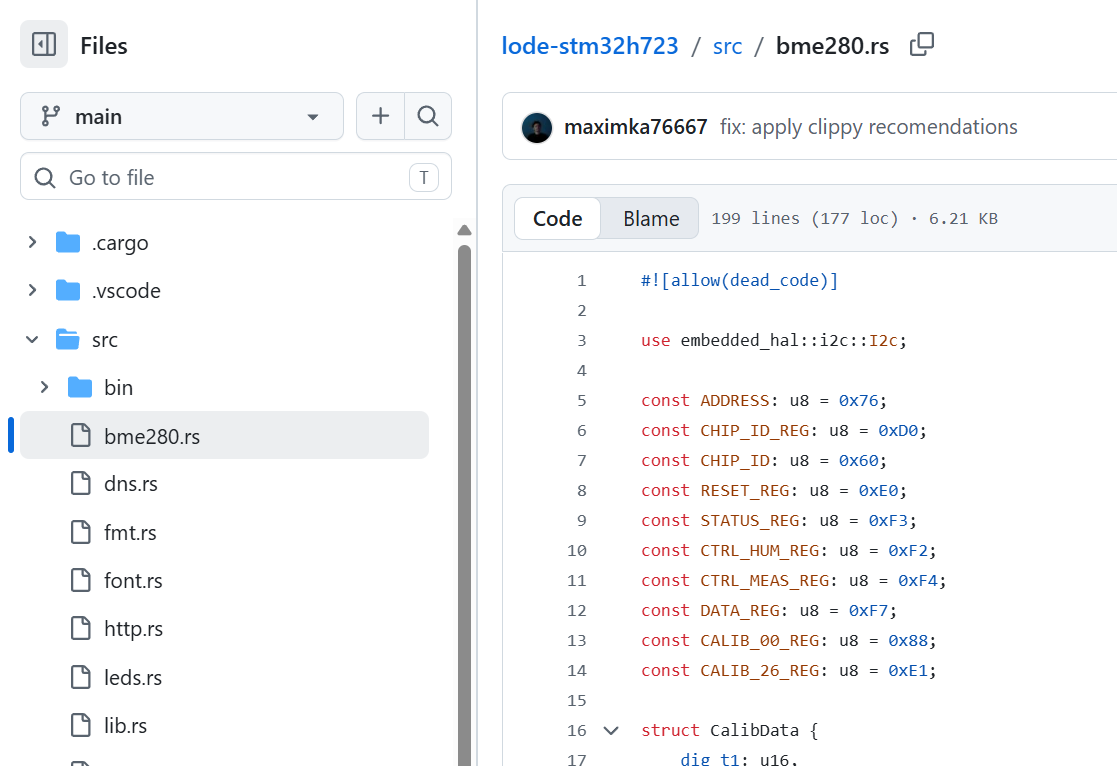
Sensor drivers
The sensor drivers are written in Rust, so the same firmware runs across different STM32 variants without rewriting the low-level code.
It runs in the browser — no setup needed.
Try it yourself →OS Compatibility
Swiss Kyle
Built with Tauri, so the same app runs natively on both Linux and Windows.
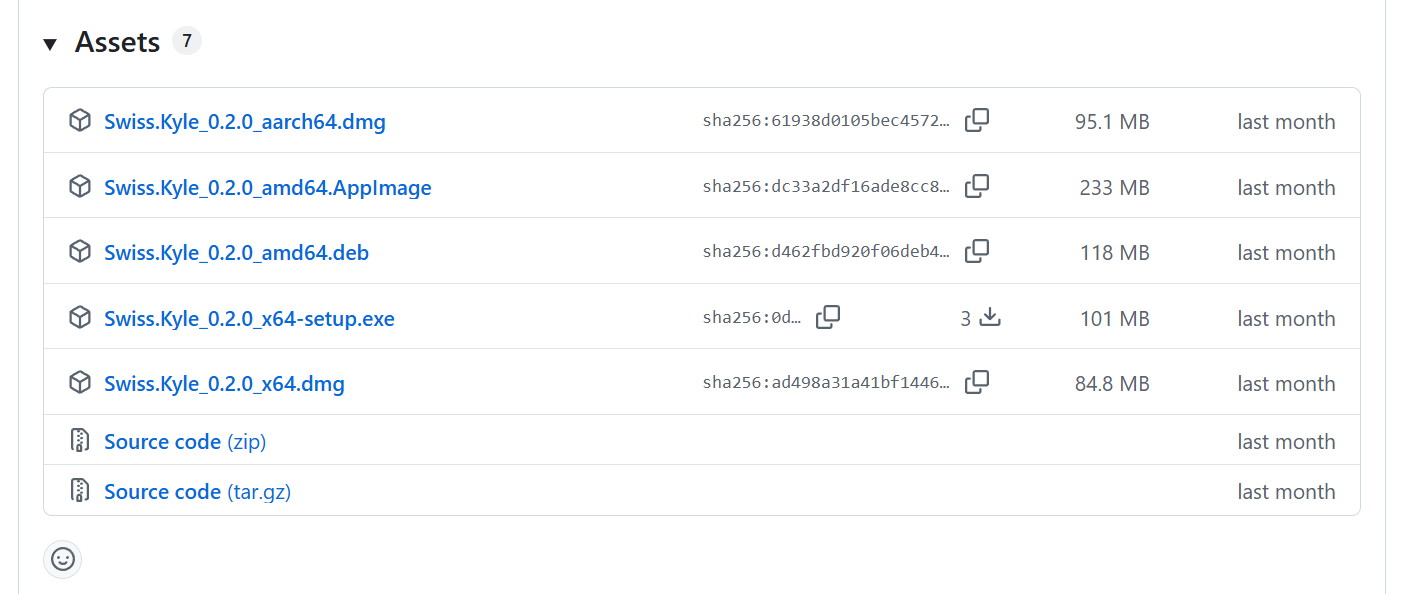
Native on Linux and Windows
The desktop app is built with Tauri, compiled as a native build for each platform rather than one shared bundle.
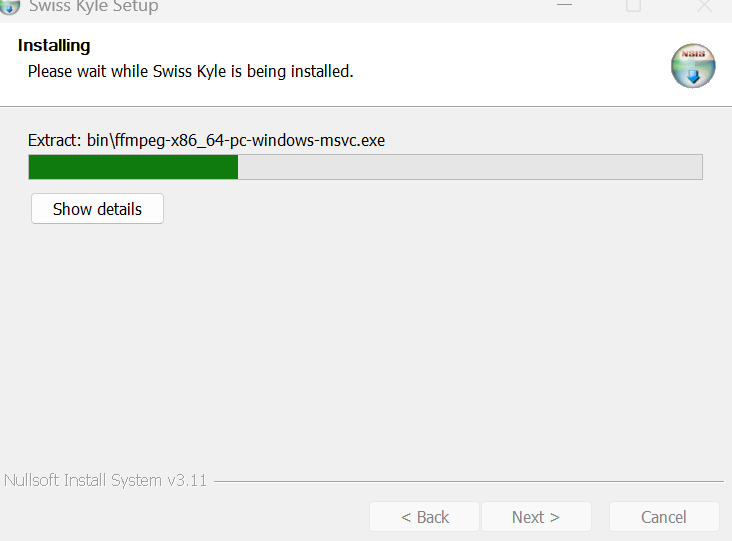
Per-platform sidecars
The app bundles external tool binaries — nats-server, pandoc, typst, pdfcpu, ffmpeg — pinned and downloaded per OS at build time.
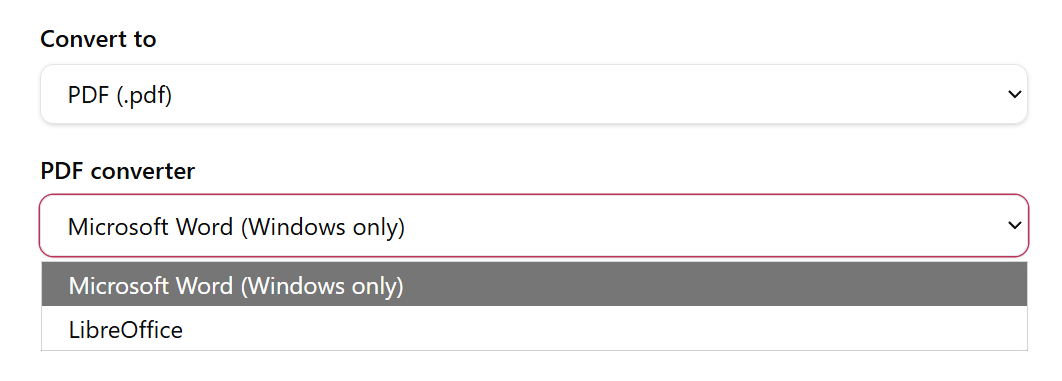
Windows-only conversion path
Office-to-PDF conversion needs LibreOffice or Microsoft Word. Since Word only exists on Windows, that conversion path branches by OS.
OS Compatibility
Hyperloop Control Station
It needed to work for every team member, whatever OS they already had on their own machine.
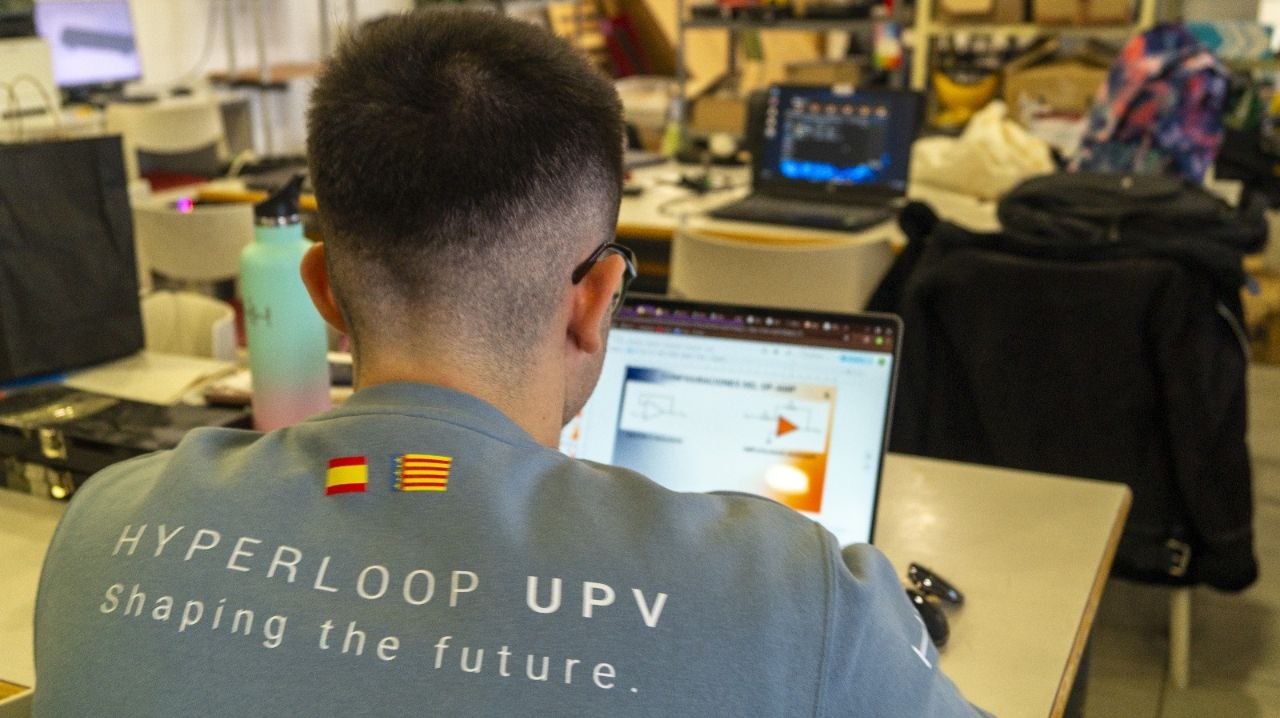
One tool, every teammate
The Control Station had to run on each team member's own machine — there was no shared or standardized setup to target.
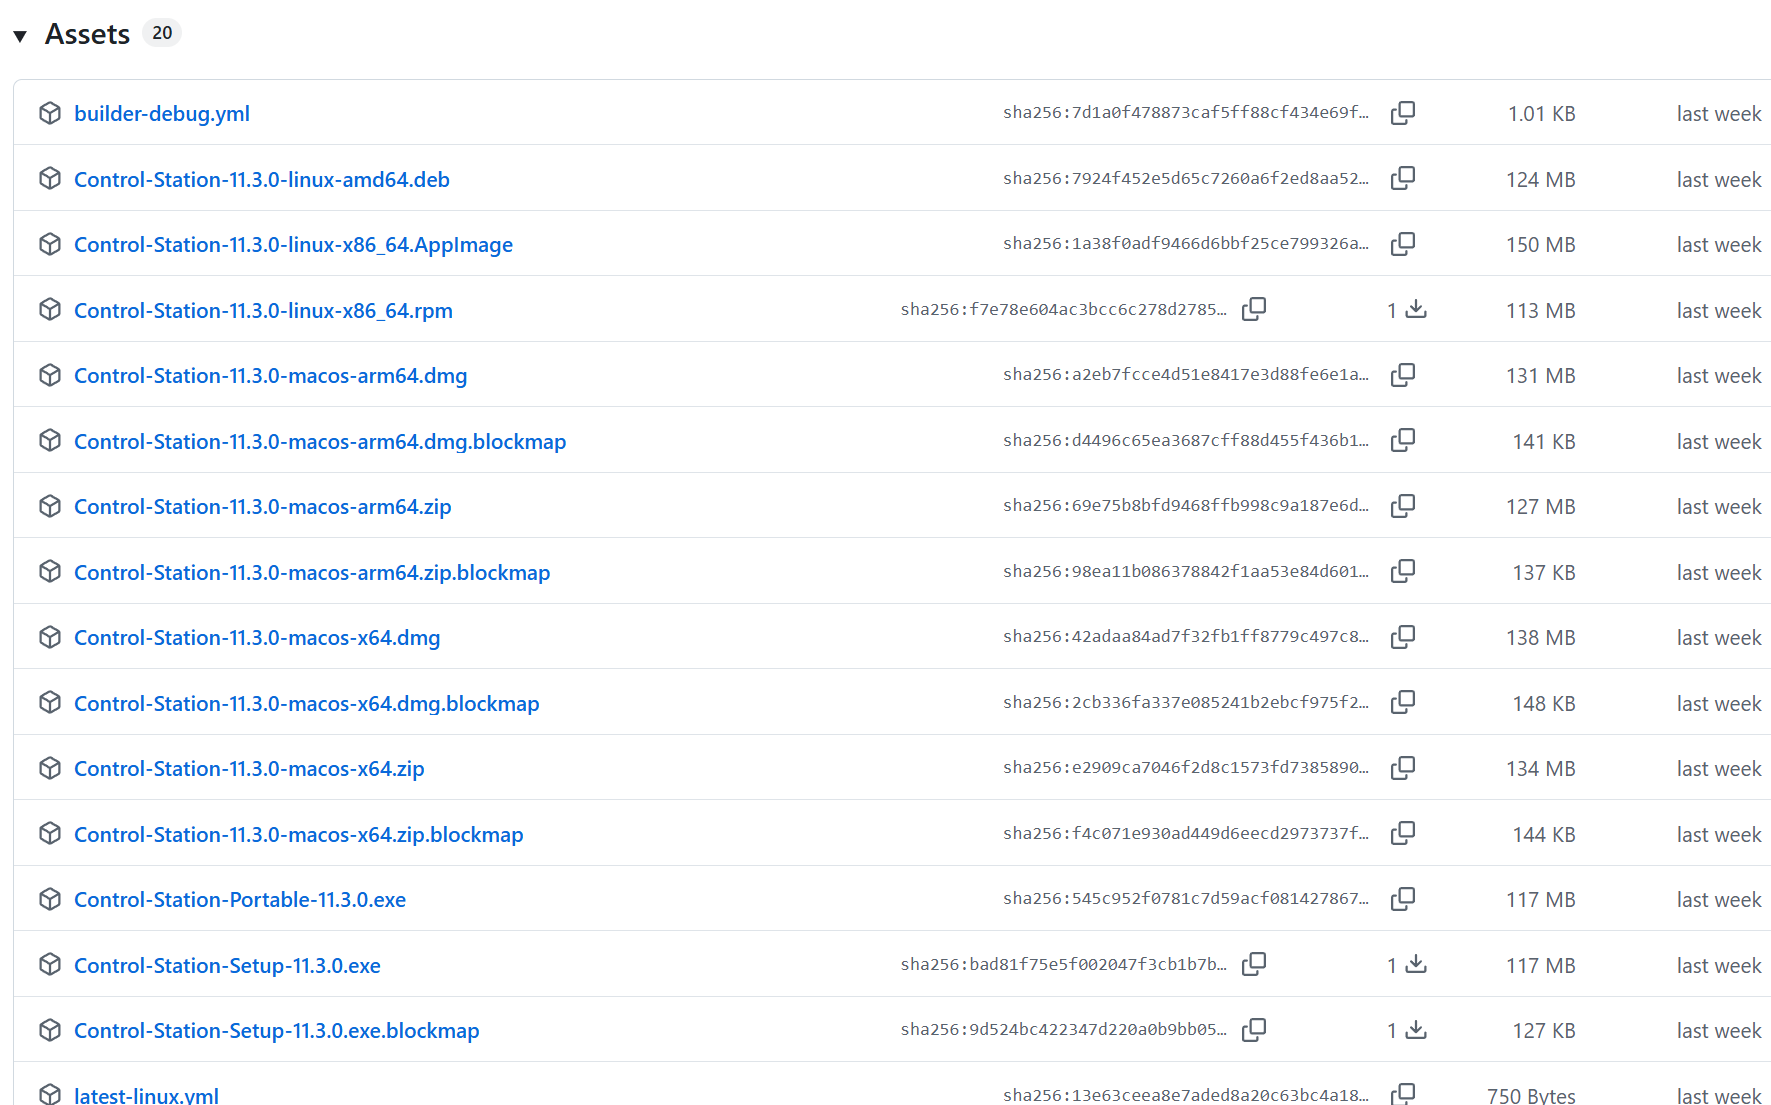
Windows, macOS, and Linux
That meant supporting Windows, macOS (Intel and Apple Silicon), and a range of Linux distributions — Mint, Ubuntu, Fedora, Arch, and others.
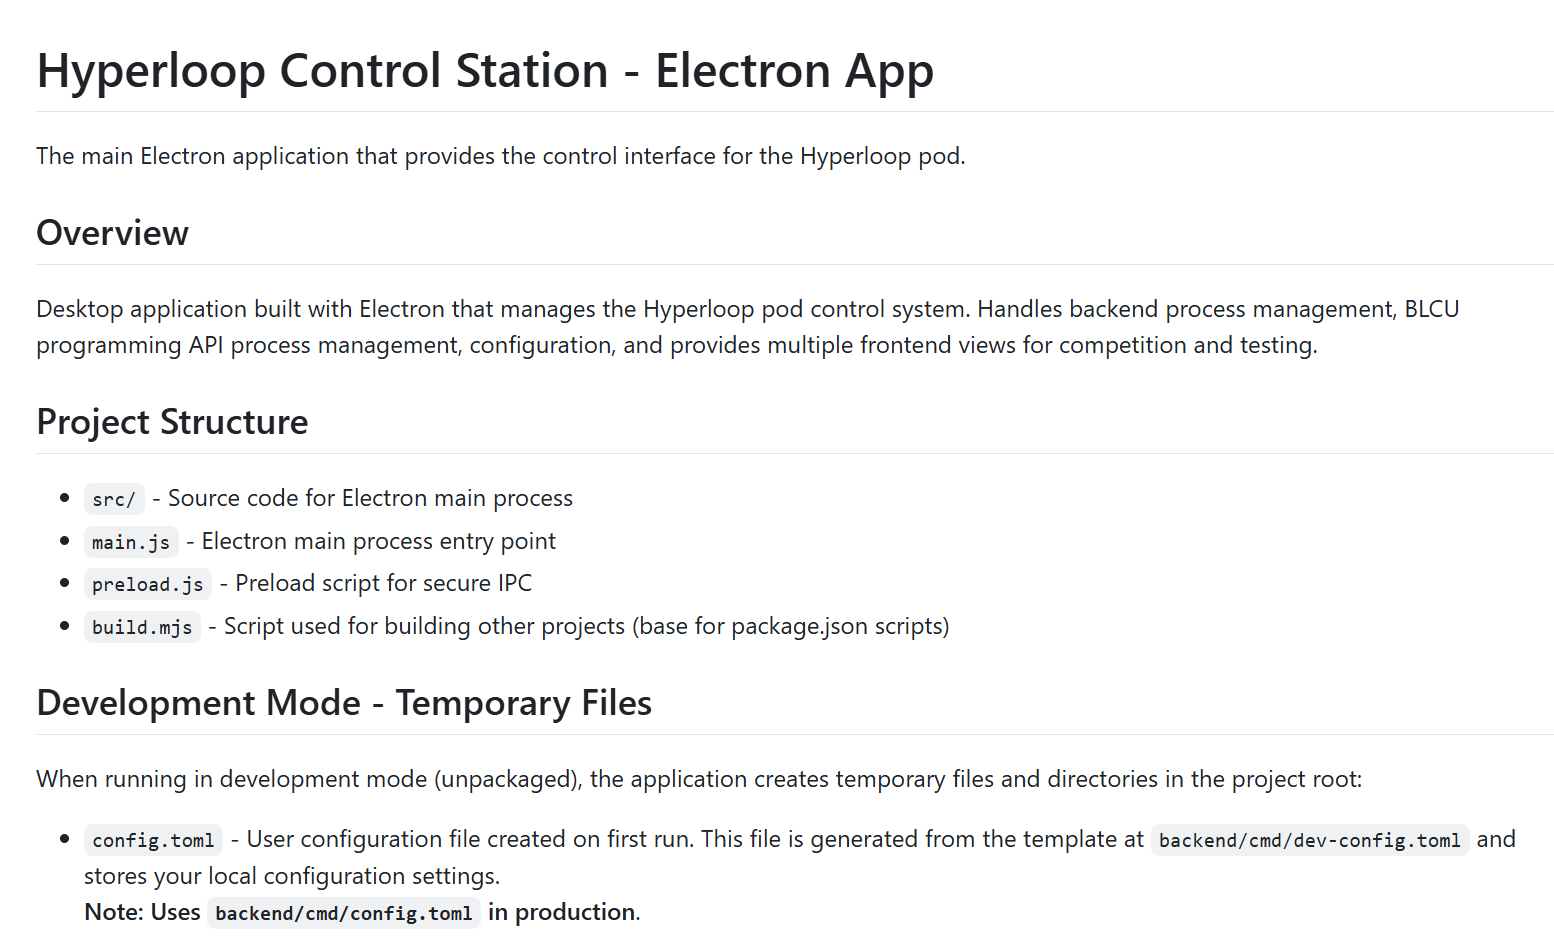
One codebase, via Electron
Built with Electron, so the same codebase ships as a native app on every platform instead of maintaining separate builds per OS.
OS Compatibility
I needed the same tool to run the same way on Windows, macOS, and Linux.
I needed the platform-specific pieces handled once, not per install.
I needed to make it accessible to anybody.
Performance
Lode
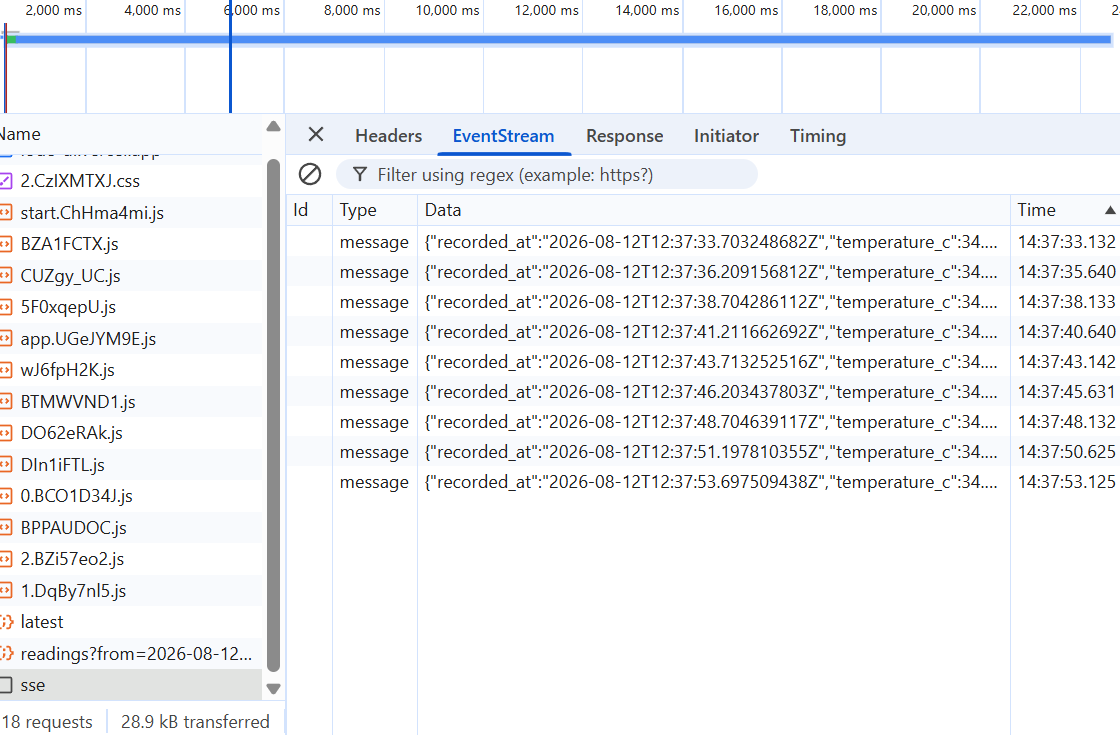
Every reading has to reach every connected dashboard in real time, without letting database writes slow down the stream.
Dual-channel pipeline
Each incoming reading is broadcast to every connected SSE client immediately, on a separate channel from persistence — so one reading fans out to many dashboards without re-querying the database per client.

Batched writes
Readings aren't written to Postgres one by one. They're buffered and batch-inserted every 30 seconds, cutting database round-trips without delaying what clients see live.
Configurable flush interval
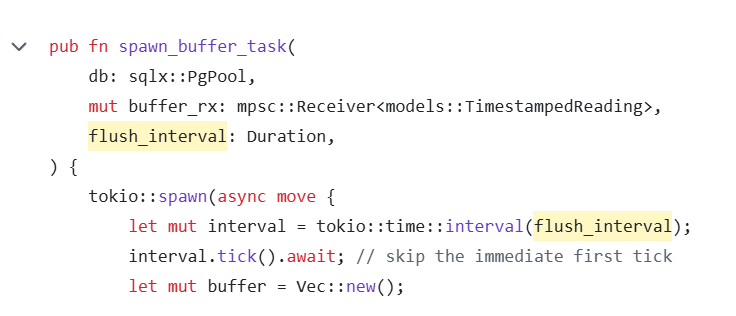
The buffer flush interval is configurable — 30s in production, 100ms in tests — so tests verify the pipeline quickly, without long sleeps.
Performance
Swiss Kyle
Every action kicks off its own background job — many can run at once, and one shouldn't slow down or break another.
Worker pool
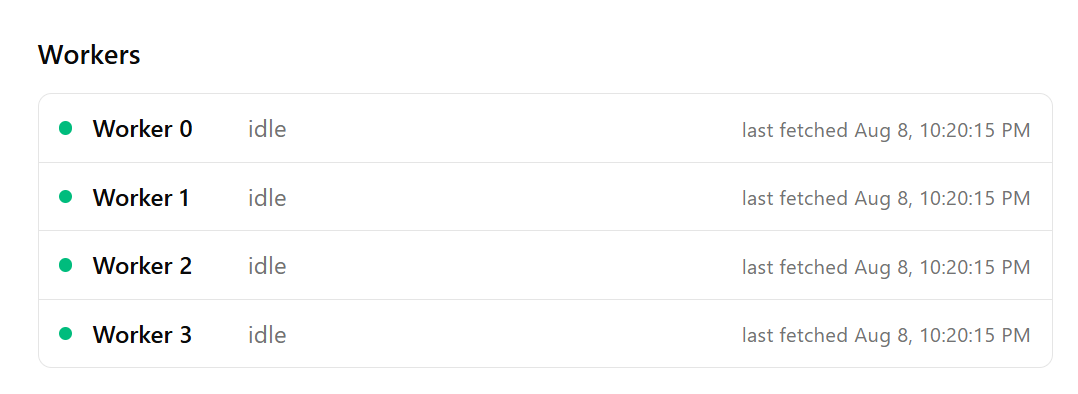
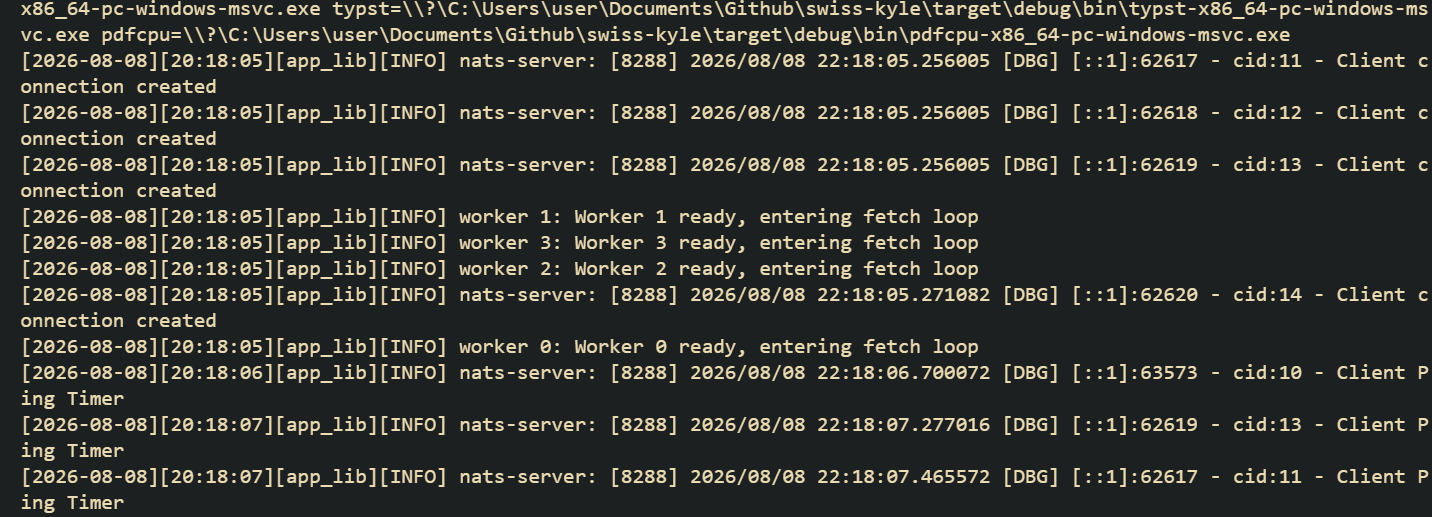
Jobs are distributed across a pool of 4 workers, so up to 4 jobs run at once without affecting each other — a slow or failing job never blocks the rest.
Job queue
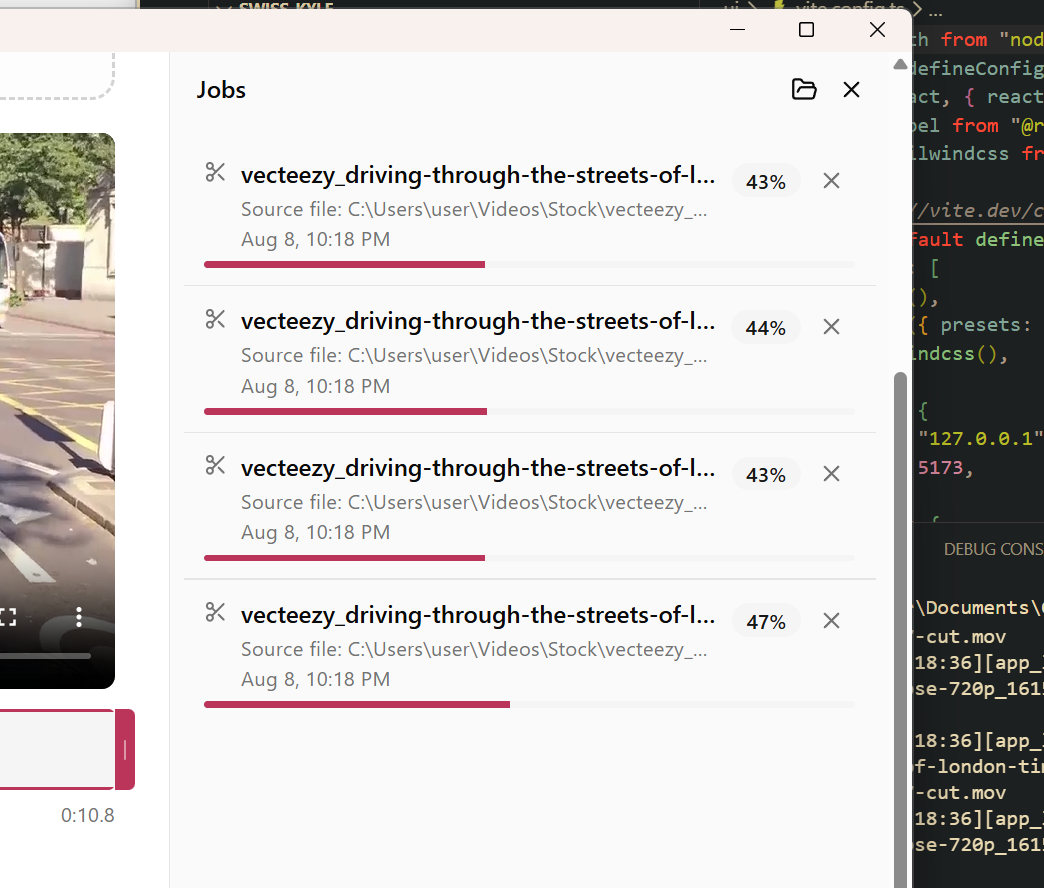
If no worker is free, the job is queued with NATS JetStream instead of dropped or run inline.
Failover
If a worker fails, its job isn't lost — thanks to the persistent queue, it gets picked up by another worker instead.
Performance
Hyperloop Control Station
With new data arriving faster than every 100ms across dozens of charts, redrawing the whole interface on every packet isn't an option.
Batched updates
Incoming packets are batched instead of triggering an immediate render, so the whole interface never re-renders on every packet — even with many charts live and data arriving faster than the eye can follow.
Virtualized telemetry panel
The telemetry panel is virtualized, so rows with constantly changing colors and values that aren't currently visible to the user skip updating entirely.
Bounded chart memory
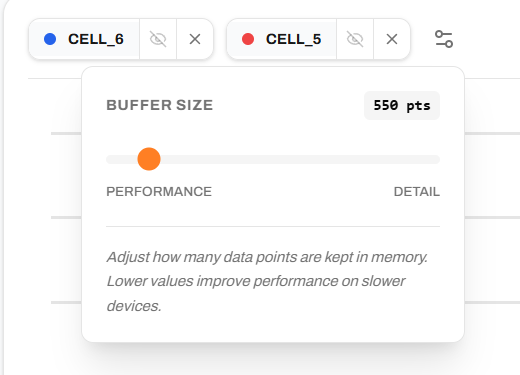
Charts don't store every value forever. A maximum buffer size lets each user choose how much memory a long-running session is allowed to use.
Performance
One task failing couldn't take the others down with it.
The interface had to keep up under hundreds of packets a second.
And it had to keep running for months without a restart.
UI/UX
Lode
For a live sensor feed like this, you need to trust it's actually live, and still be able to look back at what happened before you started watching.
Time range
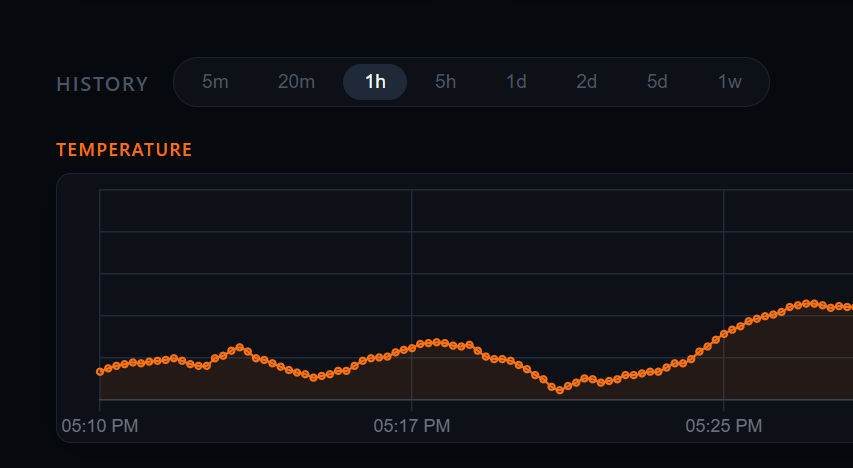
A time range selector scopes every chart to a window — 20 minutes, 1 hour, 5 hours, or multiple days.
Live status
A status badge always shows where the feed stands — live, waiting for data, or error — so a stalled connection is never mistaken for a quiet one.
Physical display
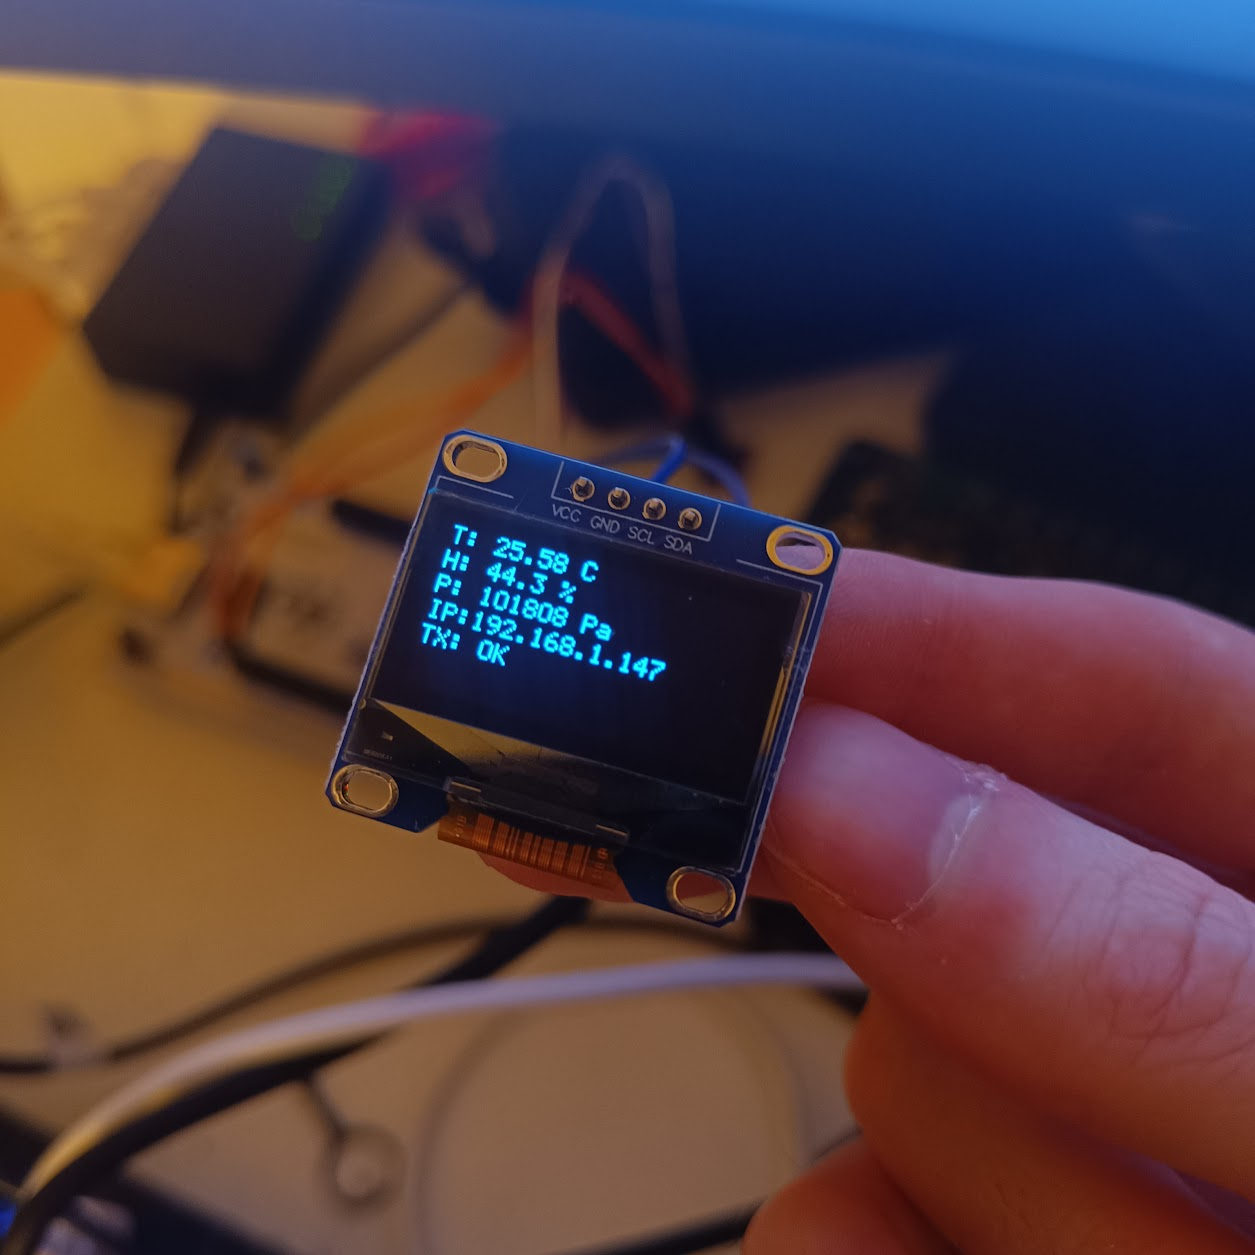
A physical display mirrors the same data, so it's visible at a glance without opening the app.
UI/UX
Swiss Kyle
Every action here kicks off a background job, so you need to trust it's actually running, and know right away if it didn't.
Document upload
Documents are added by drag and drop. An unsupported format shows an error.
Job status badges
Every job carries a status badge — running, done, or failed — always visible in the sidebar.
Diagnostics
The diagnostics page shows worker status and the job log, so problems are visible as they happen.
UI/UX
Hyperloop Control Station
For a critical system like this one, you need to always be aware of its state, and a fast way to get to what you actually want to see.
State
The app always shows its current state — active, loading, error, or dev mode.
While loading, the relevant functionality is disabled, so the user can't interact with it unintentionally.
Drag and drop
Charts are built with drag and drop — drag a variable onto the canvas to create a chart, or onto an existing chart to add it there.
For anyone who'd rather not drag, a plus button does the same thing manually.
Workspaces
Different configurations live in different workspaces, so switching context is one click instead of reconfiguring everything.
New workspaces can be added anytime, for however many setups you need.
Keybindings
Every user can bind their own keys to commands, for speed and convenience that match how they actually work.
For critical commands, keybindings provide a fast way to execute them.
UI/UX
These are tools people use to get something done.
When the interface gets in the way, people end up fighting it.
Making it something people actually wanted to use mattered as much as making it work.
UI/UX
Performance
OS Compatibility
I've made different tools, but I focused a lot on the same three pillars.
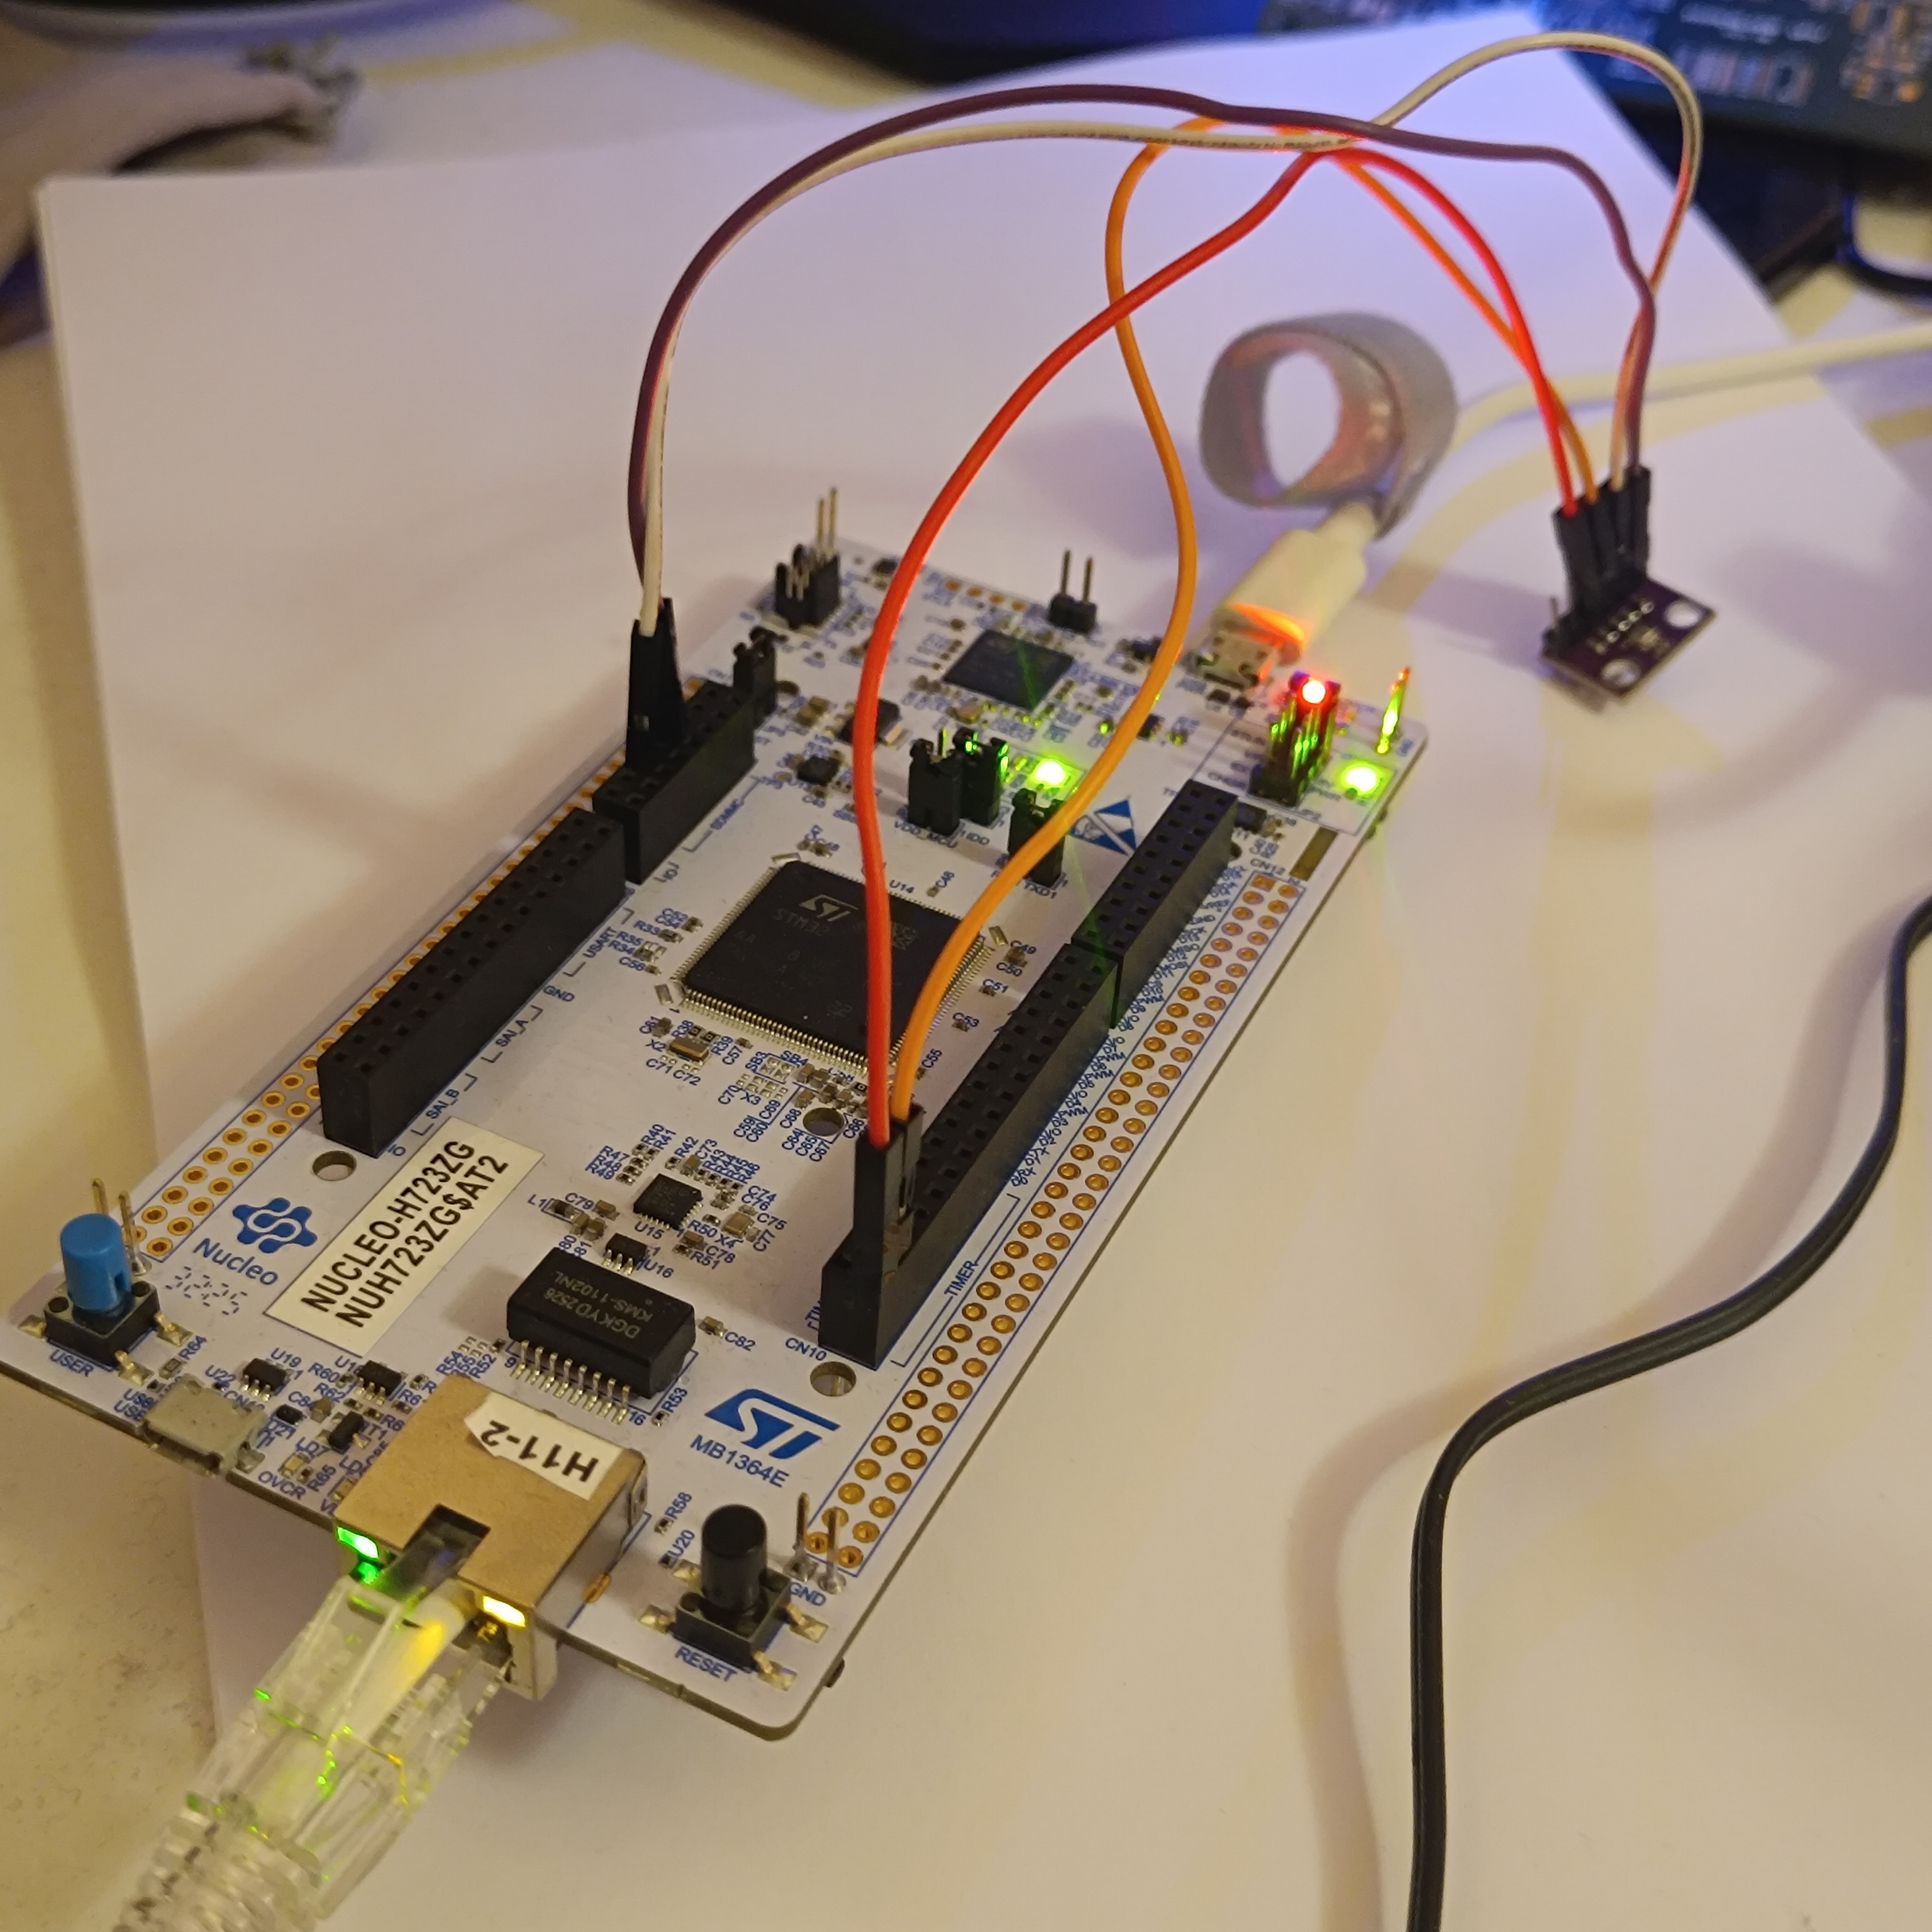
» Full stack, my board «
I built the whole infrastructure myself — the STM32 board reading the sensors, the firmware, the server, and the dashboard that streams it all live.
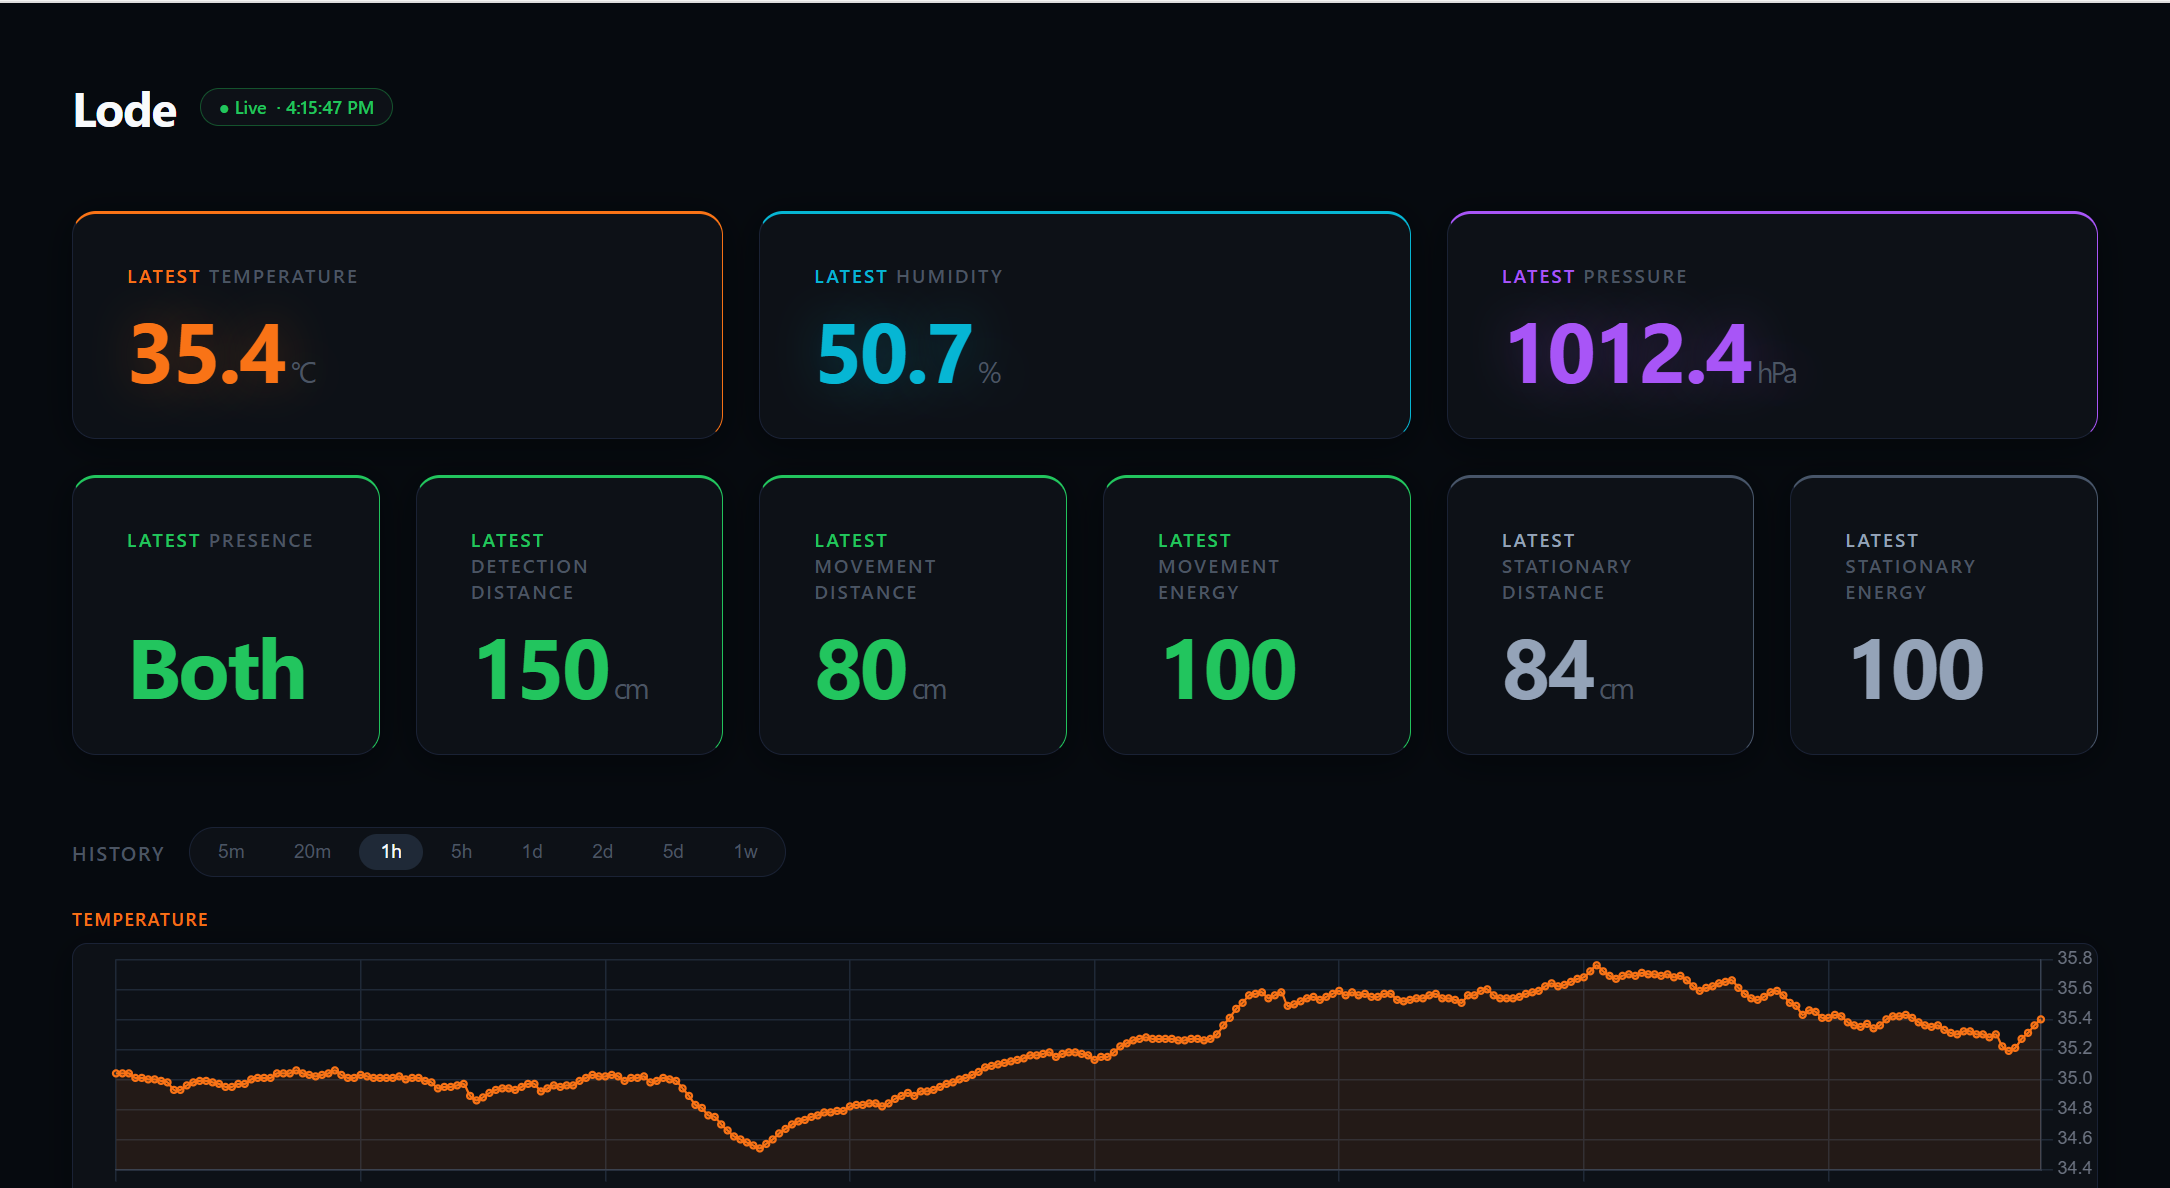
Lode
A live sensor dashboard for an STM32-based board — temperature, humidity, pressure, and human presence, streamed in real time over Ethernet.
» Why local «
I was tired of SaaS services out on the internet that make you create an account or pay a subscription.
I think a solution for such friction should be accessible to anybody.
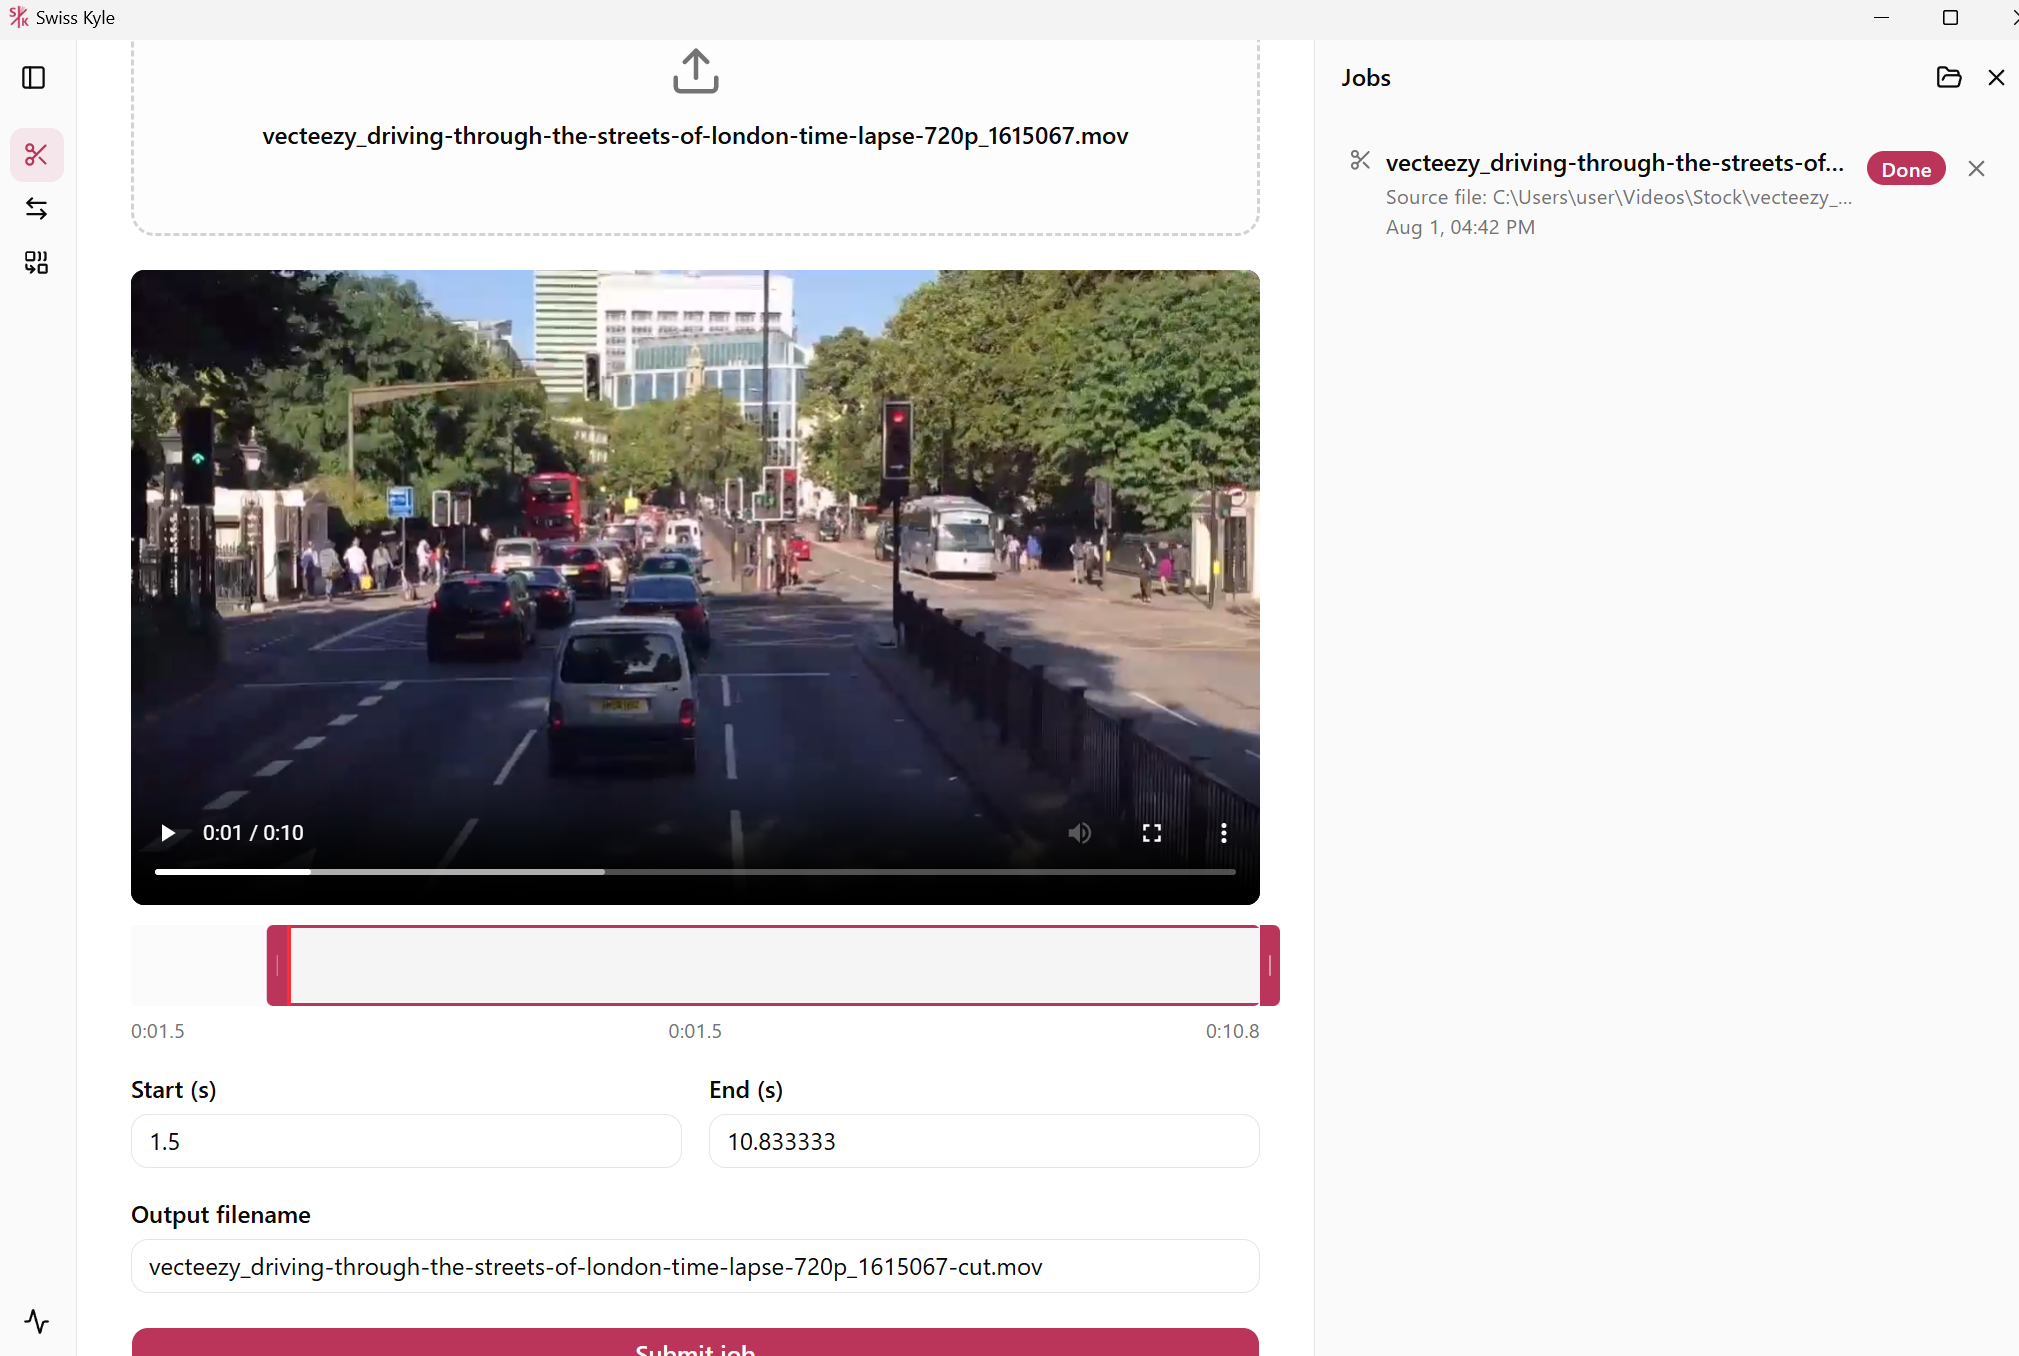
Swiss Kyle
A local desktop toolbox for frequently used services such as video cutting, document conversion, and PDF merging. You need neither an account nor an internet connection.
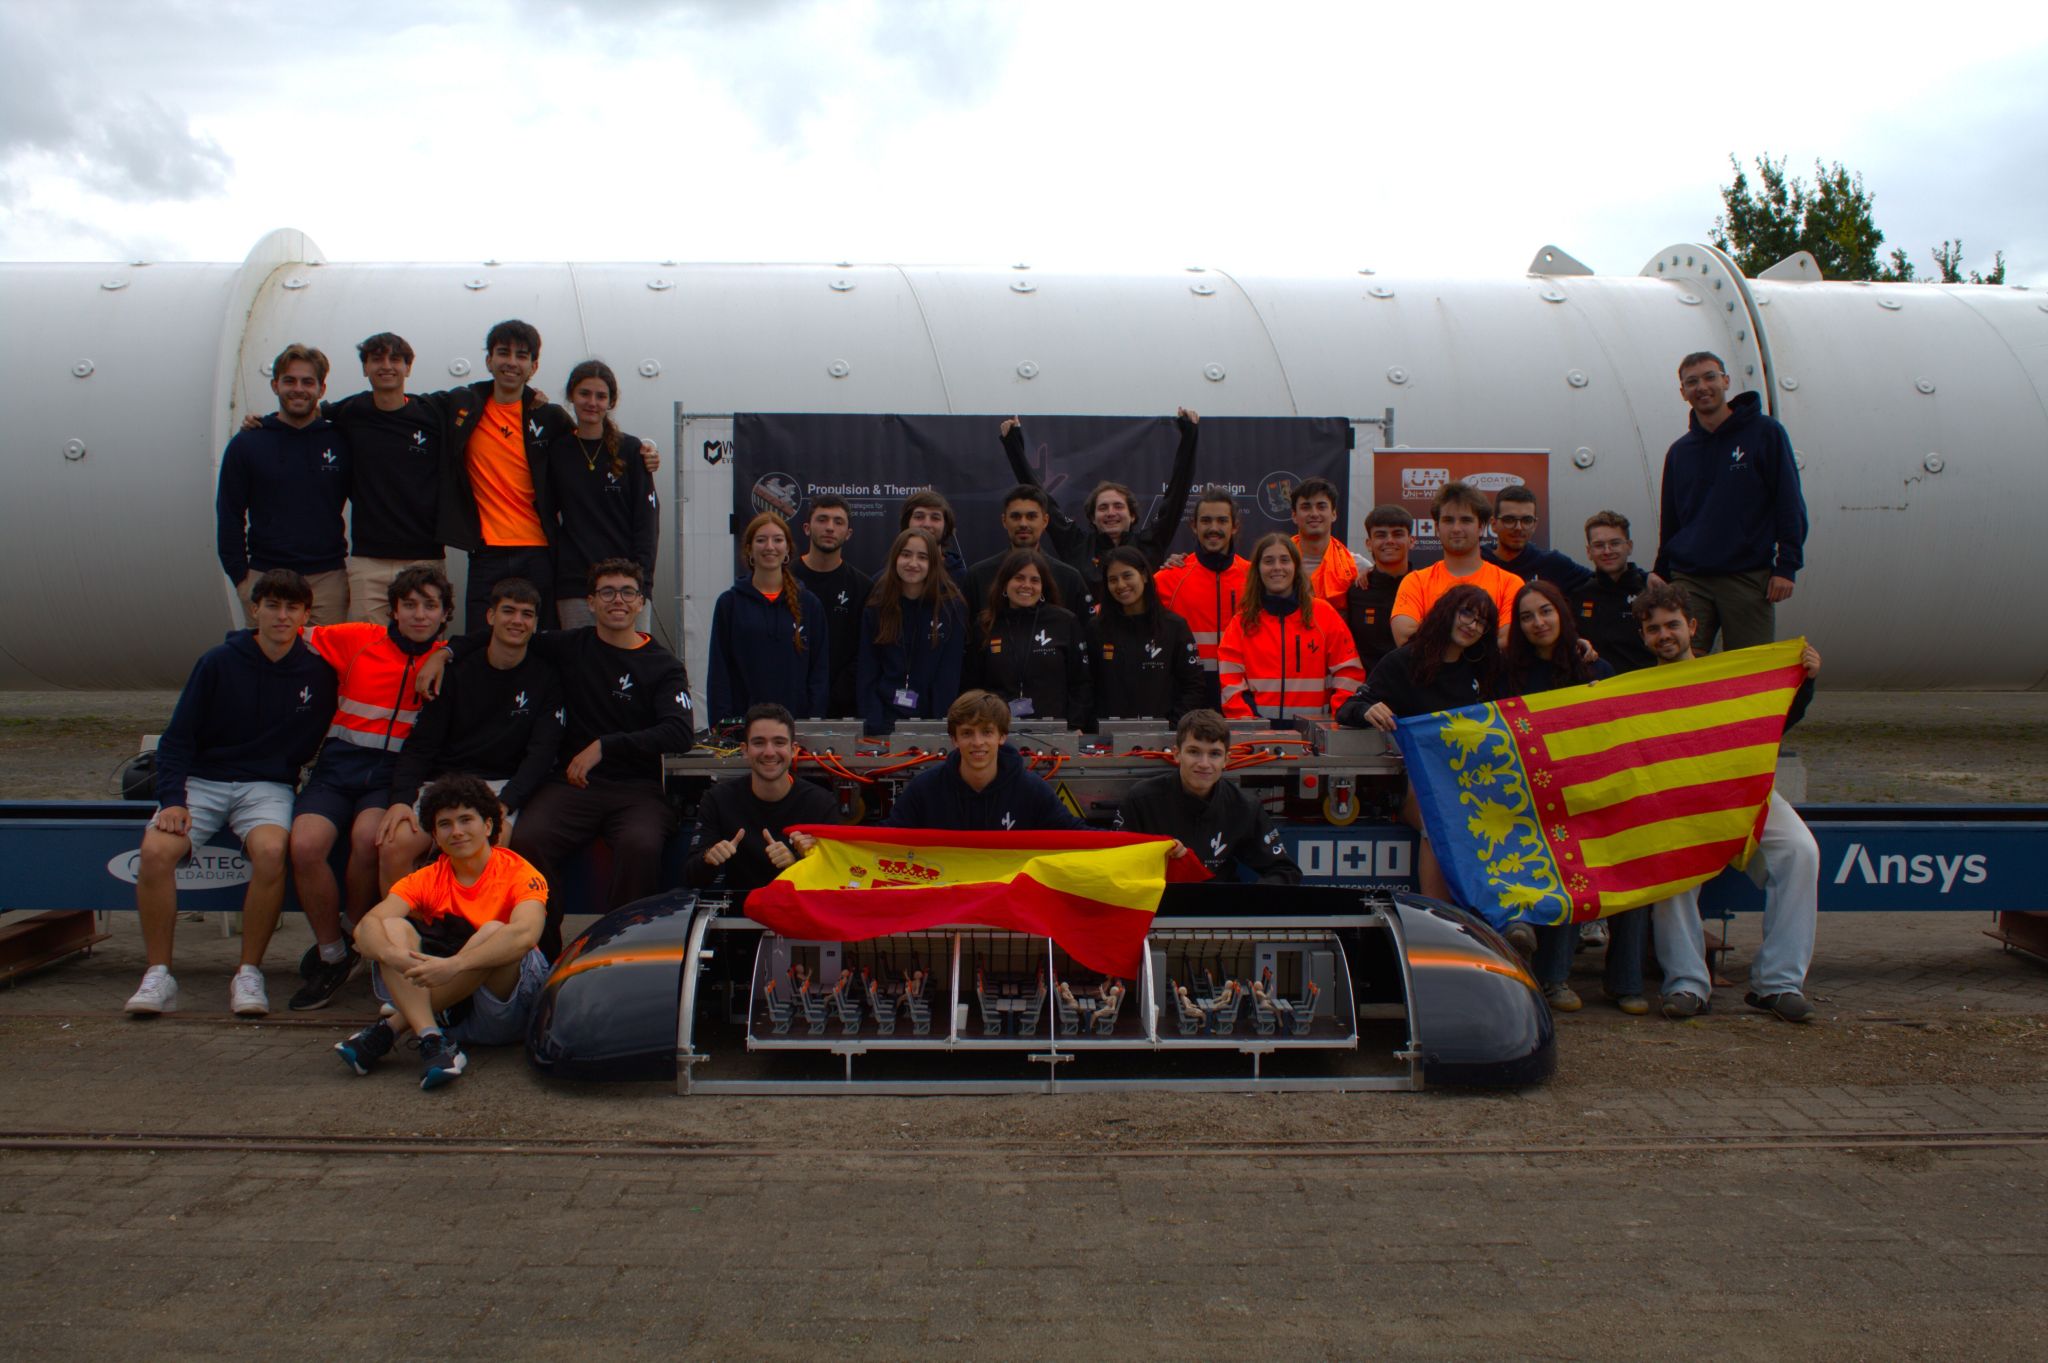
» European Hyperloop Week «
This was one of the parts that helped us take second place at EHW.
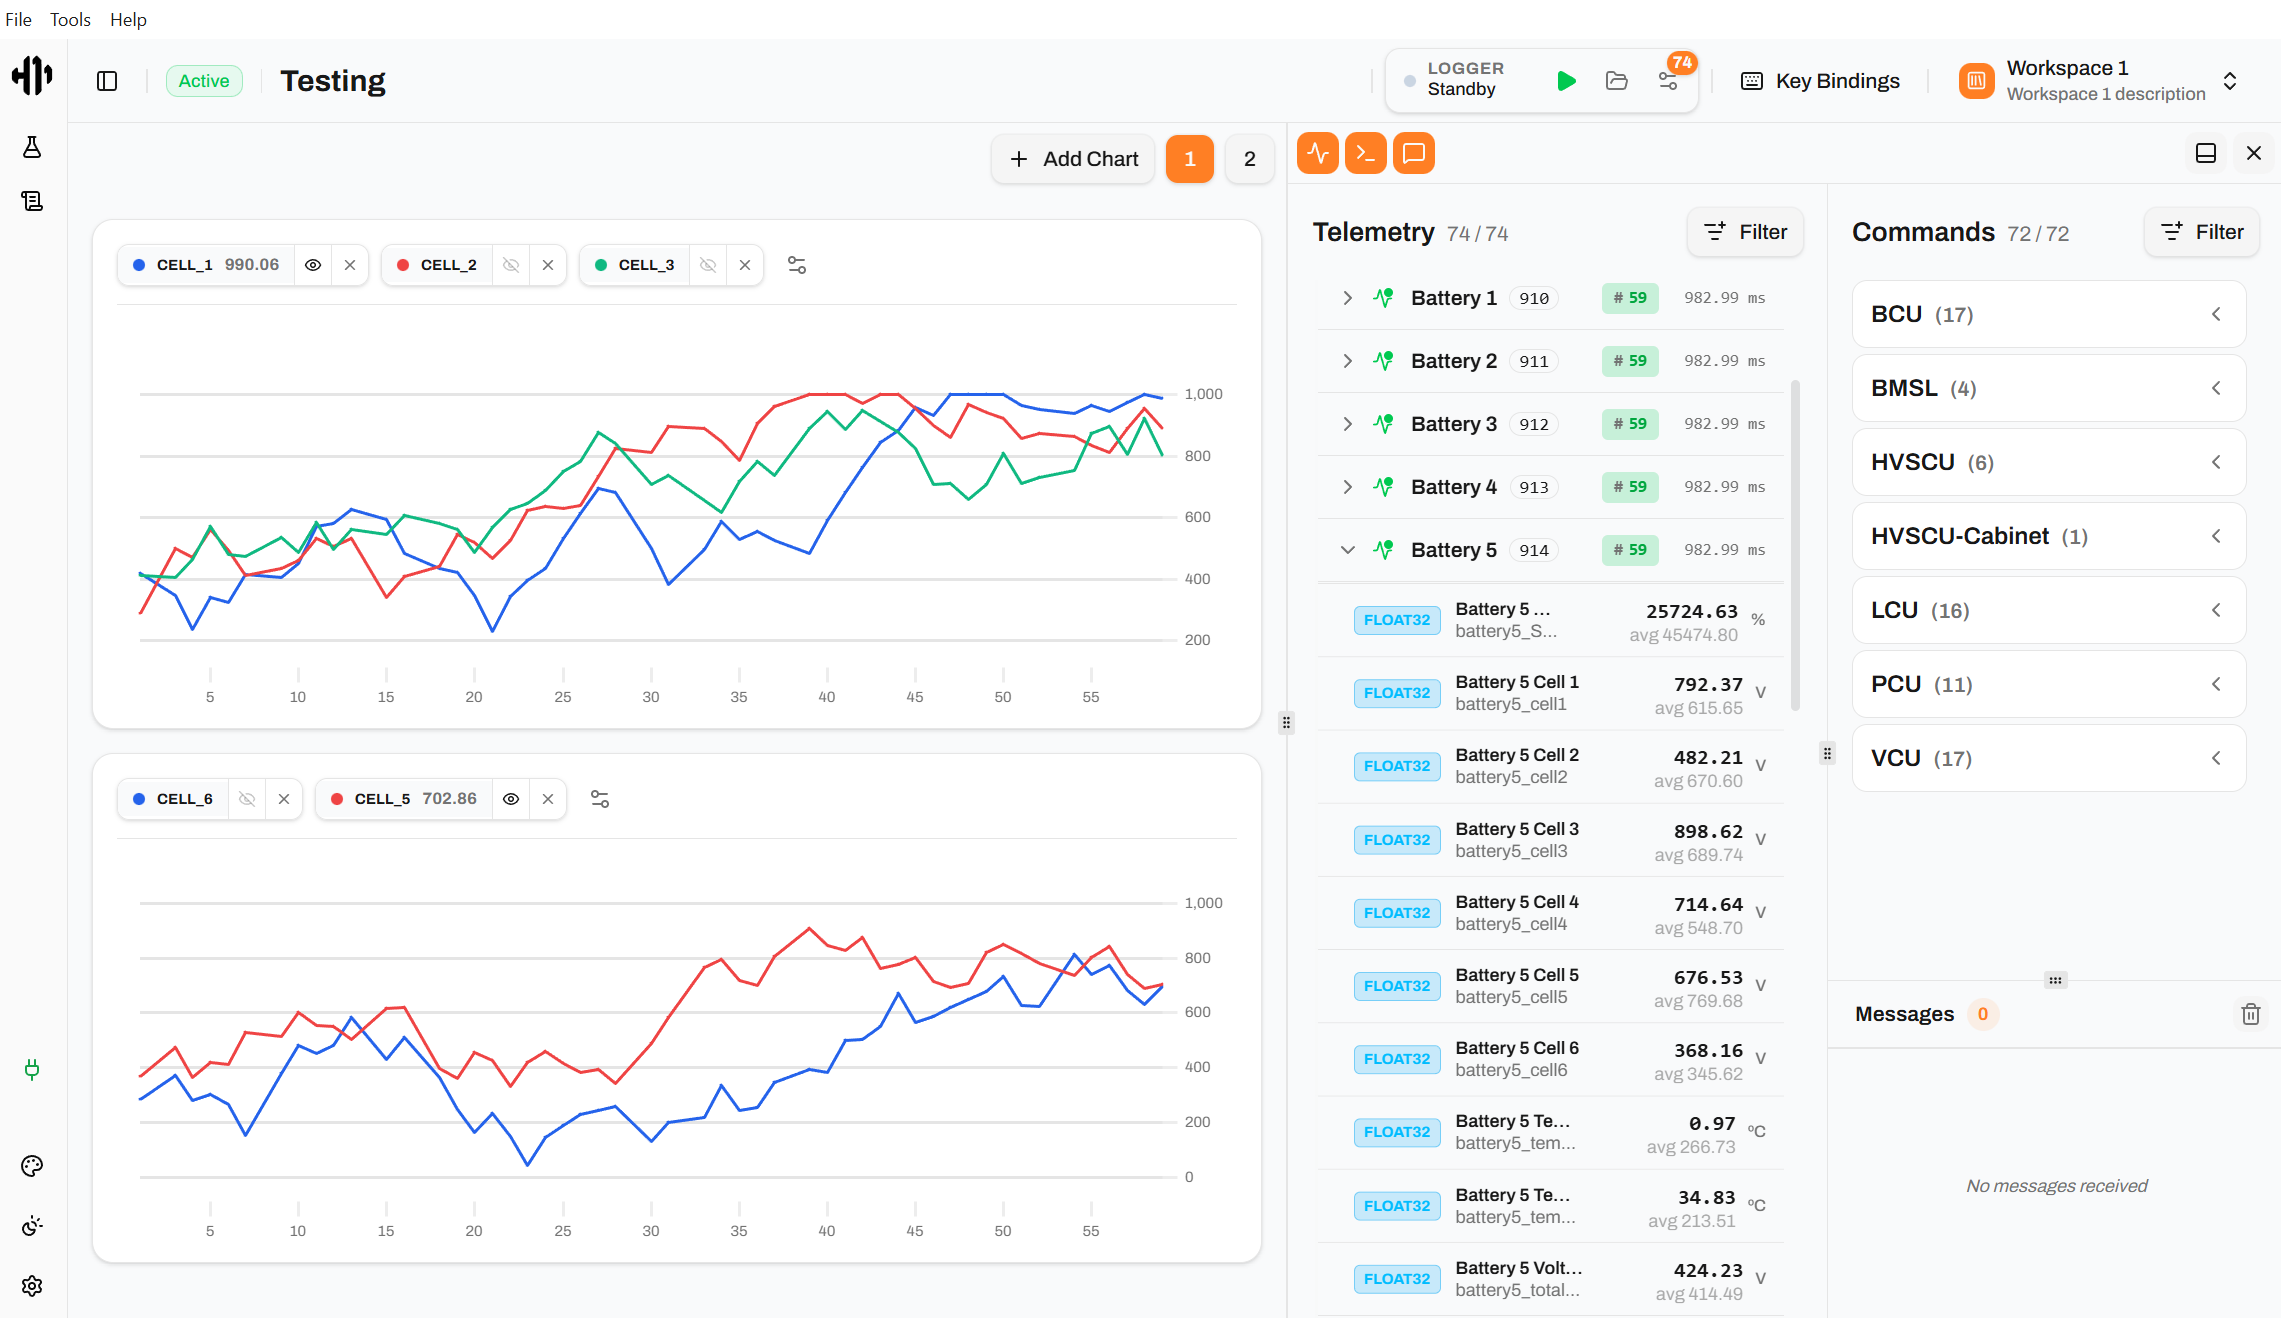
Hyperloop Control Station
A live control and monitoring dashboard for Hyperloop UPV's pod — drag-and-drop charts, workspaces, and keybindings built for a team that needs to trust what it's seeing.
My Projects
Cross-platform mission control for a Hyperloop vehicle.
Hyperloop Control Station
A swiss army knife for your PC.
Swiss Kyle
Live sensor data of my room, straight from the board.
Lode